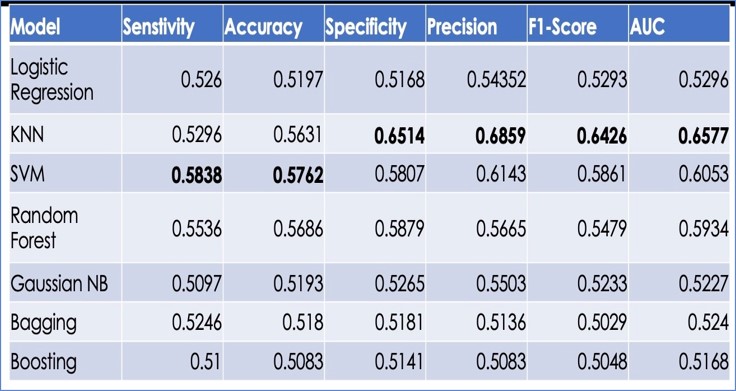
Looking at the above table, it seems like KNN has the highest AUC score (0.6577), which indicates that it performs the best among all models in terms of the trade-off between sensitivity and specificity. SVM has the highest sensitivity score (0.5838), which indicates that it performs the best among all models in terms of identifying true positives. KNN has the highest precision score (0.6859), which indicates that it performs the best among all models in terms of minimizing false positives. SVM has the highest accuracy score ,which indicates that it performs the best among all models in terms of overall performance. However, it is important to note that the best model for a specific task depends on the specific needs and requirements of that task.
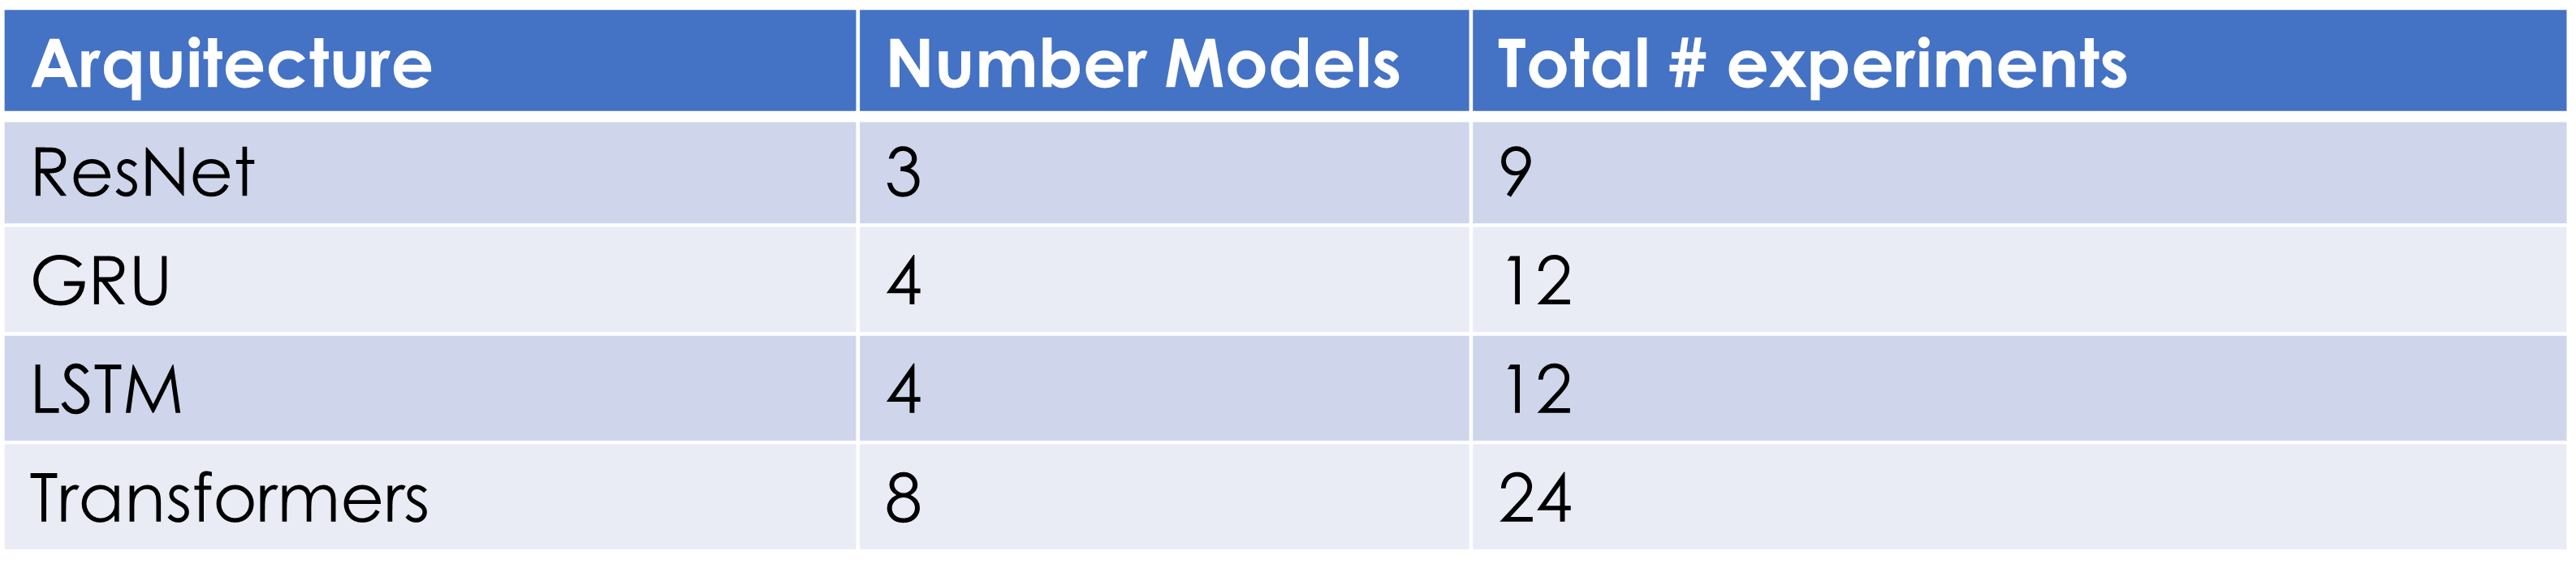
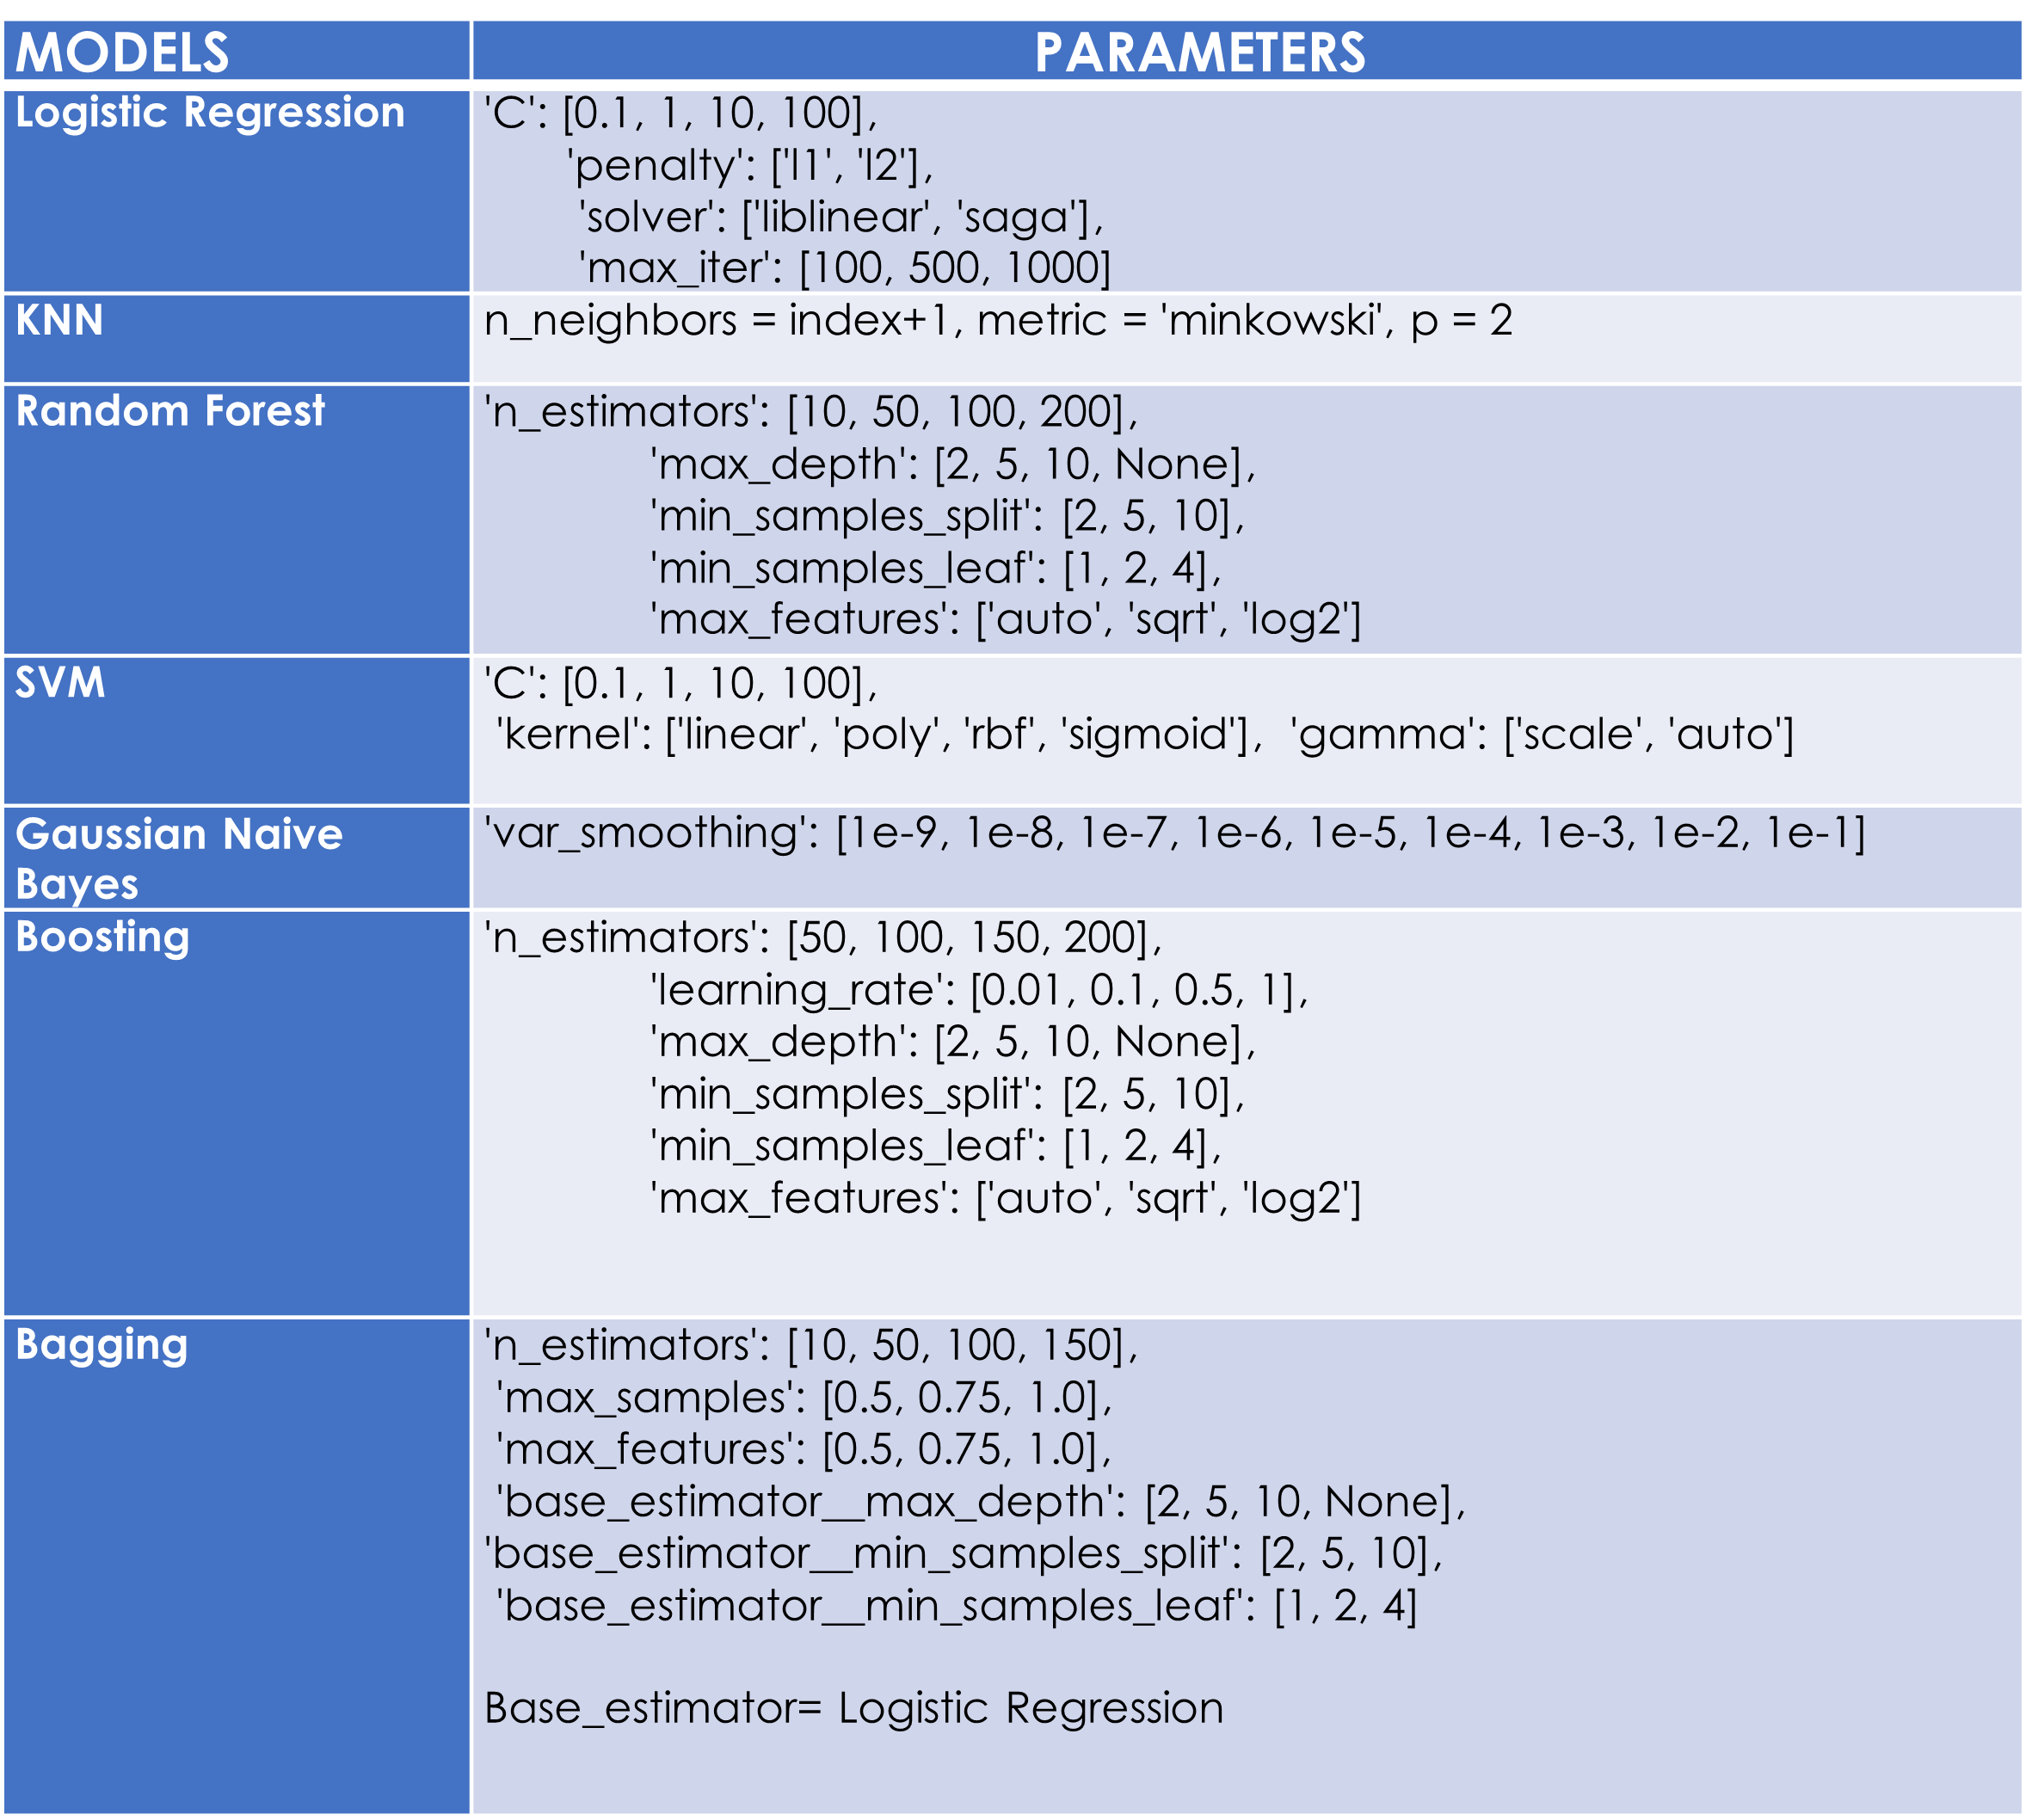
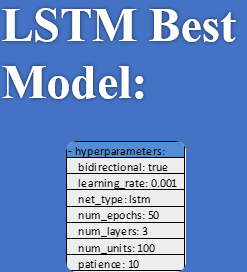
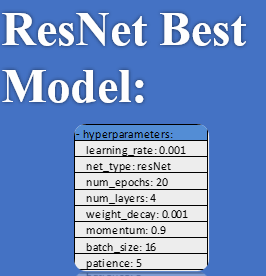
We tried different models for every architecture. It is important to notice that every model consists of different hyperparameters. So, each model was executed 3 times with different seeds and the results of these 3 experiments were averaged and this is what is to be reported.
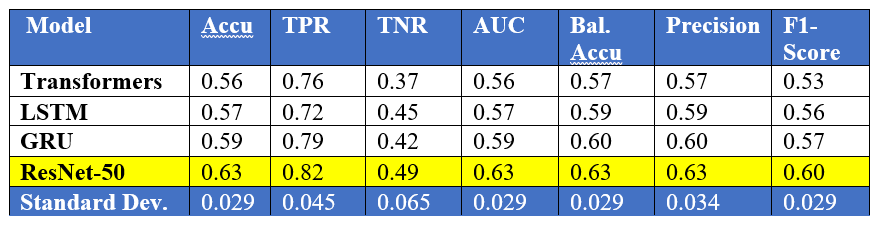
This table provides performance metrics for four different models: Transformers, LSTM, GRU, and ResNet-50. Each model has been evaluated on several metrics such as accuracy, true positive rate (TPR), true negative rate (TNR), area under the curve (AUC), balanced accuracy (Bal. Accu), precision, and F1-score.
The results show that ResNet-50 achieved the highest performance on all metrics, followed by GRU, LSTM, and Transformers, respectively. In terms of accuracy, ResNet-50 achieved the highest accuracy of 0.63, while Transformers achieved the lowest accuracy of 0.56.
The table also provides the standard deviation (SD) for each metric, which indicates the variability of the results for that metric across different models. A lower SD indicates that the results are more consistent, while a higher SD indicates that the results are more variable.
In this case, the SD for most metrics is relatively low, indicating that the results are consistent across different samples. However, the SD for TNR is relatively high, indicating that the TNR results are more variable across different models.